
When you think of smartgUI, you may always think of a lot of small js/css text files and a couple of resources to be loaded. All together act as smartUI Page like this:
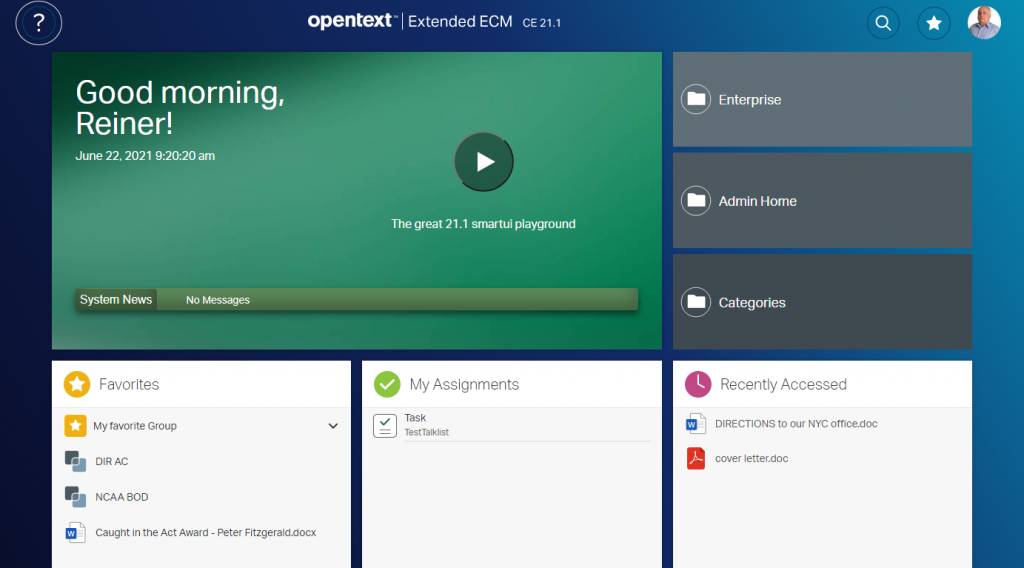
This is a typical landing page. With such a page you can control, how your perspective is working and also if certain commands, controls and widgets are correct. For example, the widget ot the top left is a modified Welcome Widget showing System Messages and other news channels.
What else can a browser do for you in your continuing quest to produce an awesome user experience for an enduser?
A lot! First, open the development tools in the browser. Here we are using Chrome, but this tools are available on all browsers.
Developer tools – a closer look
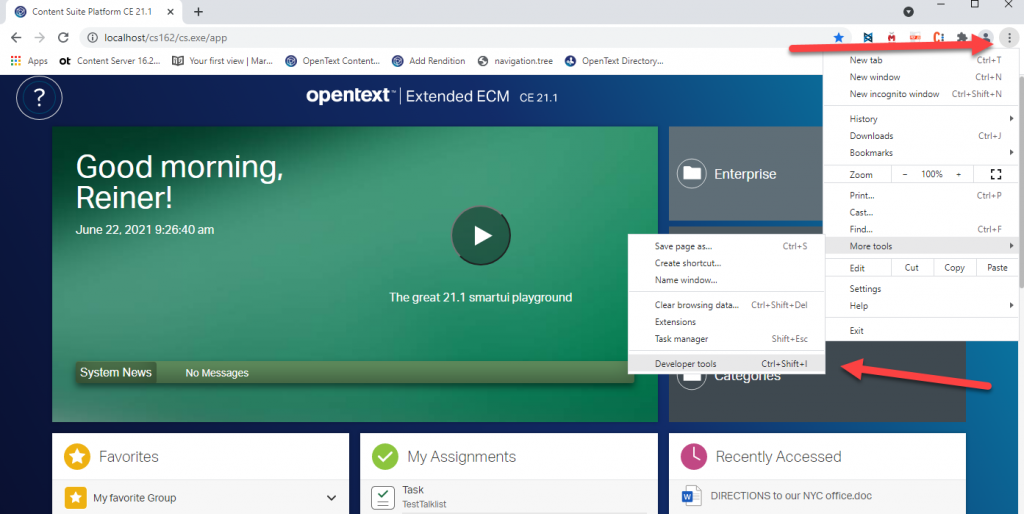
Press Ctrl+Shift+I or the Develeloper tools entry in the menu.
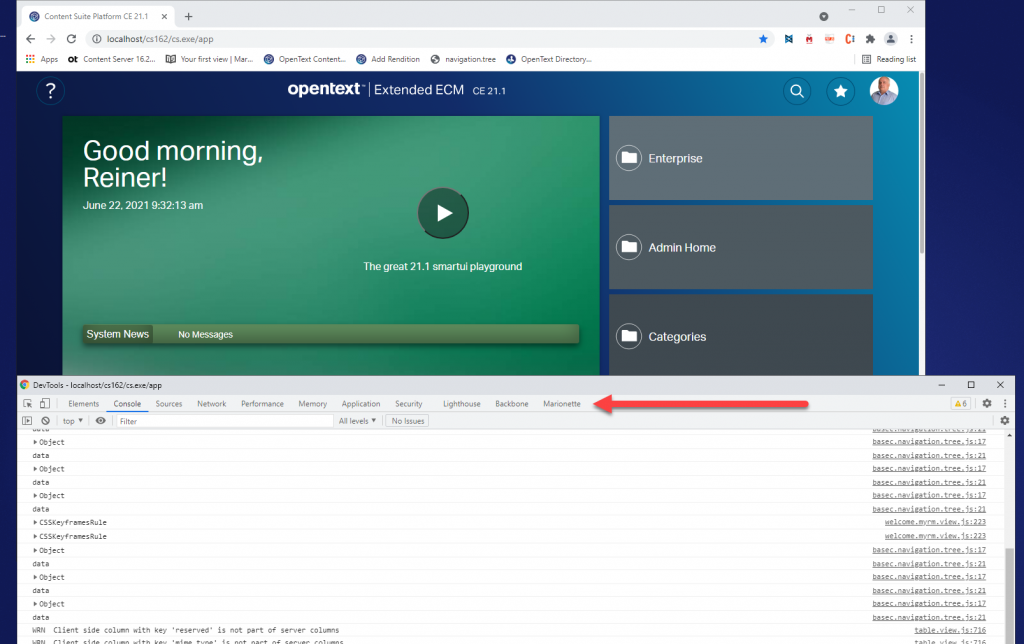
This will open up the develeloper tools. The functionality is subdivided in several tabs. The most important (from left to right) are
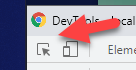
- Elements. Gives you the possibility to see the actual DOM loaded, Here you can change css and other elements and you’ll see immediately the effect. The rightmost icon lets you identify any element on the screen (and display it in the DOM). Thaty a handy way to identify elements on the screen and to which js file they belong (Similar way as we had in legacy gui with oscript in these ancient times)
- Console. Gives you all messages from the browser. You can see all module messages, also missing modules are displayed in red. There are several levels of messages, which can be filtered. Here, since this is a develeopent VM, all levels are activated.
- Sources. The main tab to work with.
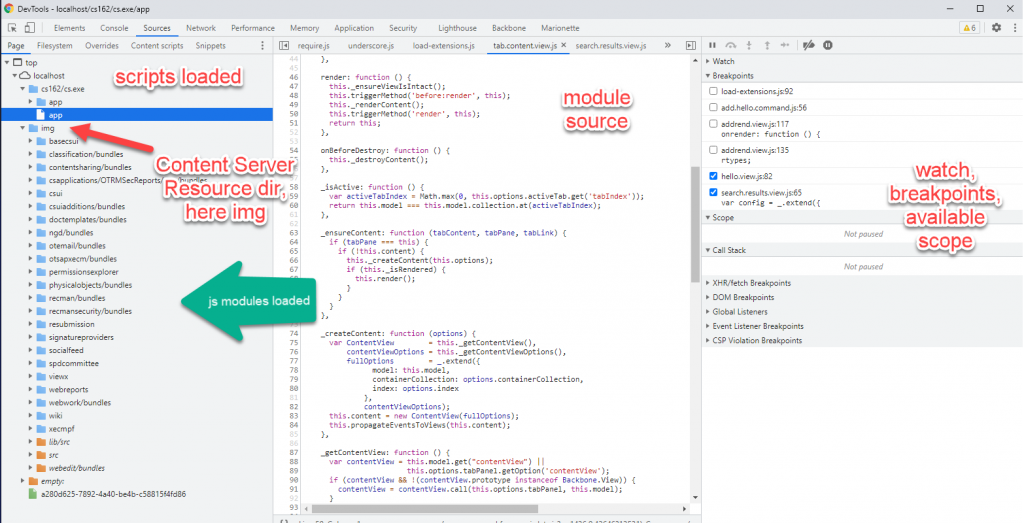
The complete smartUI is loaded in the browsers memory (except those data parts, which will be changed via REST/Ajax later on). So we can examine directly, whats happening in the browser.
Interesting is the treeview at left:
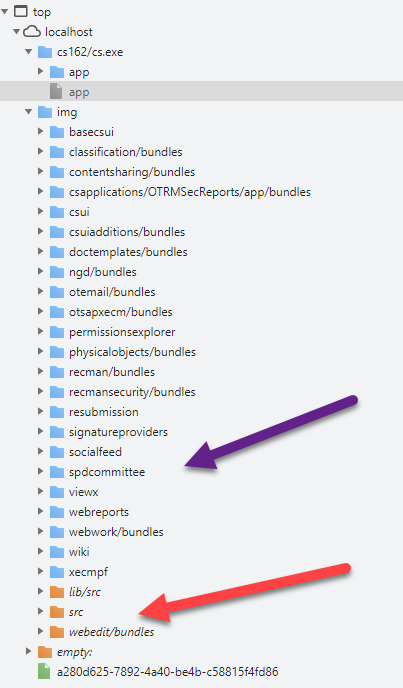
We see blue and orange folders, which can be opened. Lets open a blue folder, for example the “New Generation Desktop” ngd and the resubmission
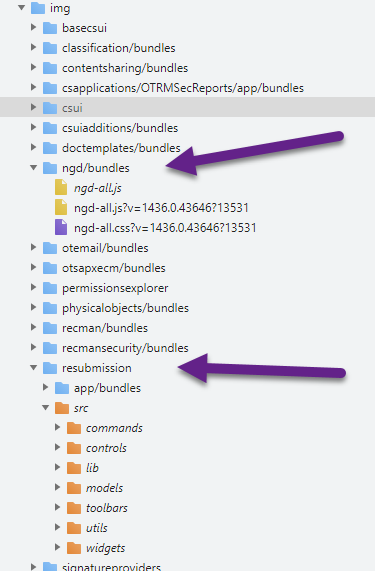
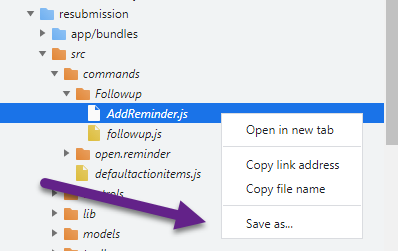
First, we see, the ngd has the name ngd/bundles. It contains the js and css bundles of ngd. Lets open another folder, the resubmission folder. Here you see a blue app/bundles folder and an orange folder named src. Here you have the standard SDK tree. If there sre orange folders, then you can browse into the source code, like this:
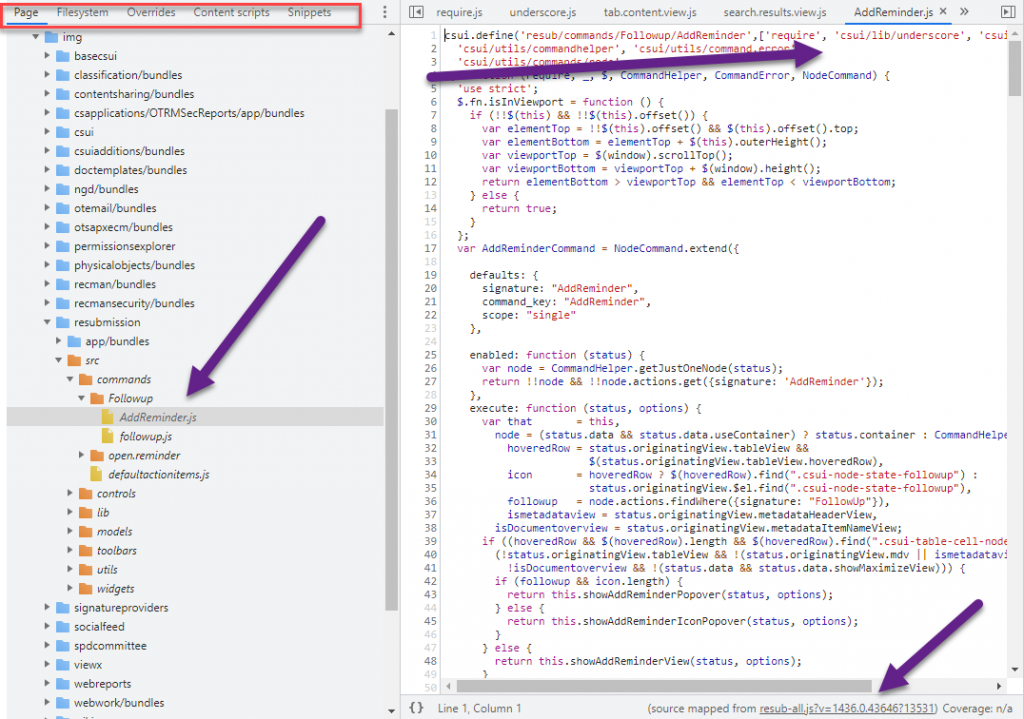
Here we checked the AddReminder.js from the reminder package, which is one of these modules not part of the smartUI SDK.
Whats to do with that file(s)? Select the file (with js extension) in the tree and right klick. Here you can edit the file or save the file to your filesystem.
Search a needle in a haystack
We have a lot of js files in the browser memory. How to search for a specific file?
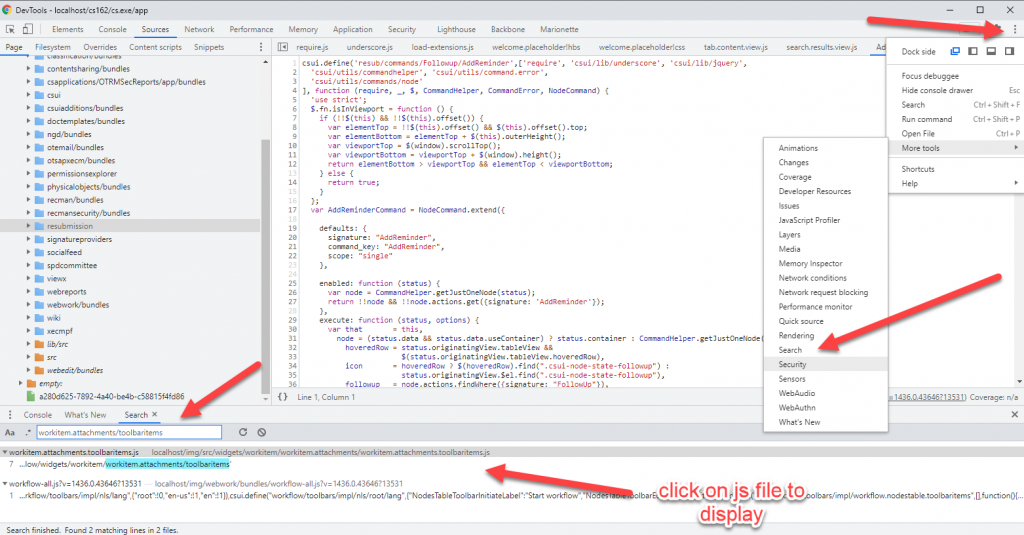
First, display the search window by clicking on the to right 3 point menu. Goto More Tools and click on Search. Then a search bar opens at the lower left. Enter your search name (mostly part of the requirejs path) and you’ll see the results. Select the .js file (bundles are not very useful to read). The file is displayed in the source window.
Our requirejs paths in the browser
Sometimes its quite nice to inspect the loaded requirejs modules in the browsers memory.
At first, we have to switch to the debugger mode. So open the console tab and type “debugger” in the last line to put the browser in Debug mode.
Then our interestring things appear at the right of the developers tools.
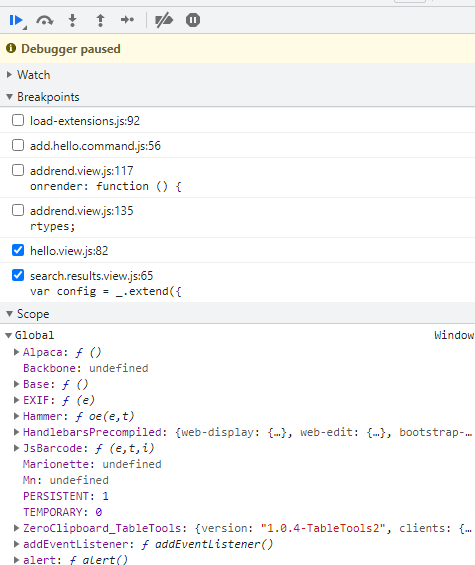
We see, the scope is filled with the loaded objects. Go to the global scope. Scroll down, until you’ll find ther csui entry. Please note, this may change to nuc from 21.2!
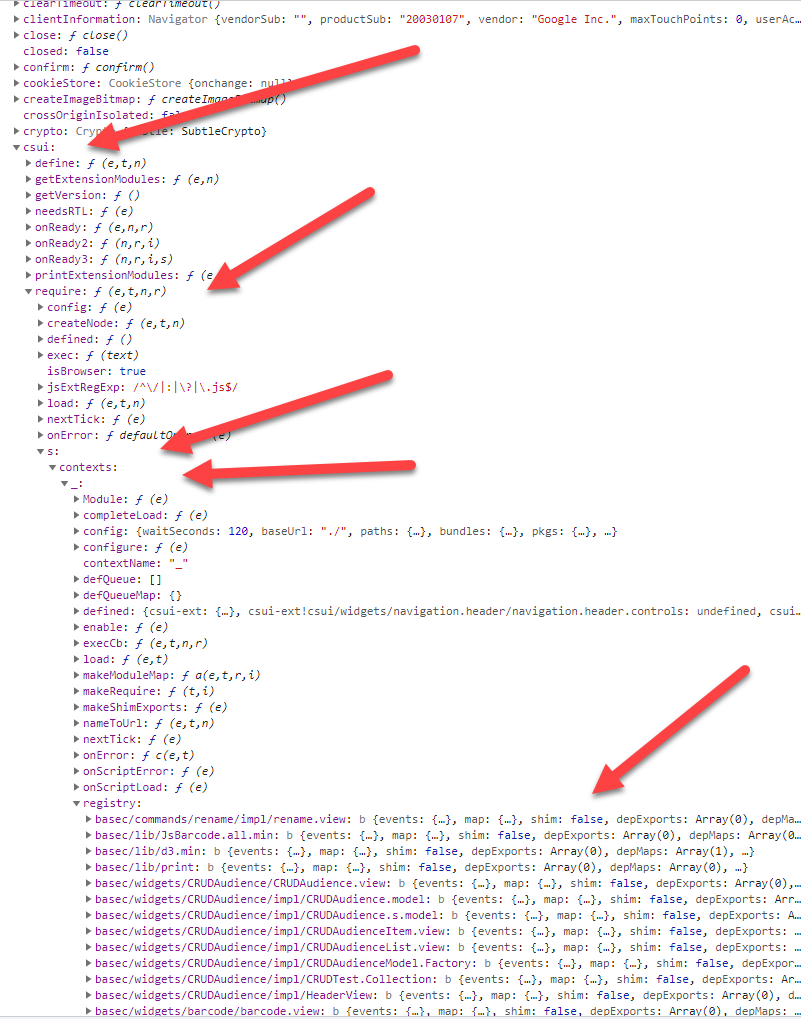
There are several entries under csui. Open the first “require” entry (or “requirejs”). Then open s. Expand contexts. Open _ (underscore). Expand registry.
Then all loaded csui and extension parts are listed in the registry. Lets examine one entry (countryselector.view).
Under depmaps, we see the dependencies.
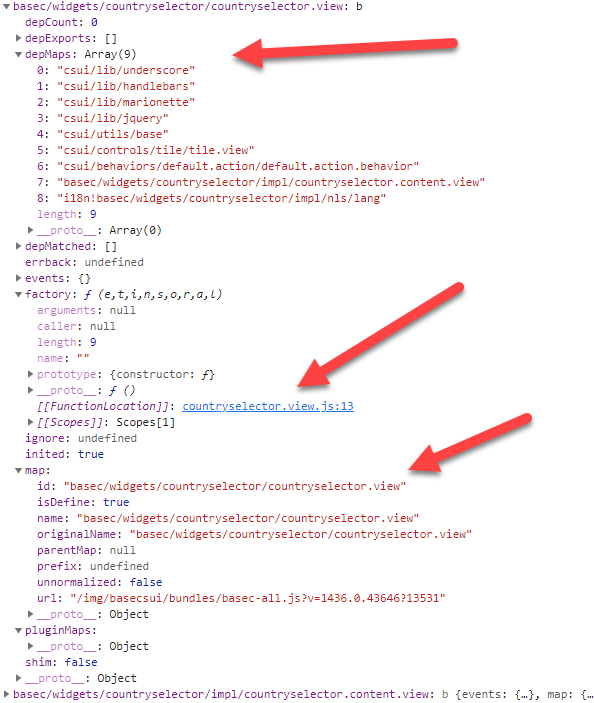
Under map we see all map related things, this is the place to override an original module with a custom one.
And we have access to the source code (if we click on the link at countryselector.view:13.)
Now you have the base for your own experiments. There are a lot of additional features in the developers tools, which could not be covered here. So: Happy experimenting.